
Why reverse engineering matters
If you have ever stared at a stripped firmware image and asked, Where does this boot? What does it talk to? Why does it lock up?, you have already touched reverse engineering.
I did not get into reverse engineering because it sounded glamorous. I got into it because I had a binary, a bug, and not enough documentation. The reality is that modern engineering constantly runs into black boxes:
- 3rd-party libraries you cannot fully audit
- Legacy devices where the original team is long gone
- Production firmware that differs from the source you were handed
- Security features (secure boot, update verification, anti-rollback) you need to validate
- Incident response situations where you need answers quickly from the binary itself
Reverse engineering (RE) is how you turn those black boxes into something you can reason about. It is not magic. It is a workflow that turns raw bytes into evidence: control flow, data flow, memory maps, and behavioral clues.
What is Reverse Engineering?

Reverse engineering is the process of understanding how a system works by studying the thing you already have, even when you do not have source code or usable documentation. In software and firmware, that usually means starting from a binary (EXE, ELF, raw image) and reconstructing higher-level meaning:
- What functions exist
- How control flows through boot and initialization
- What protocols or data formats are used
- Where key features, checks, and handlers live
Think of RE as turning an opaque blob into a map that you can navigate, reason about, and communicate to others.
How RE Helps Solve Real-World Software Problems
In embedded and firmware work, reverse engineering is not just a security hobby. It is often the fastest way to unblock real engineering tasks when the usual inputs are missing.
Common situations where RE helps:
- Vendor documentation is incomplete (or NDA-bound), but you still need to integrate hardware features correctly
- You inherit a device/board with unknown firmware behavior and need to debug boot failures, watchdog resets, or update issues
- A field unit behaves differently across versions and you must identify what changed (protocol handling, safety checks, timing)
- You need to validate security properties (secure boot checks, key rotation, update signatures) from the actual binary, not just a spec
- You are interfacing with a black-box peripheral or protocol and want to reconstruct message formats from code paths and memory accesses
The key outcome is actionable understanding: which functions implement a feature, what inputs they expect, what states they maintain, and where to patch, instrument, or monitor.
What RE actually looks like in practice
At a high level, most firmware RE sessions follow the same arc:
- Disassembly: You start from instructions, not source code.
- Structure discovery: Entry points, init code, interrupt vectors, and call relationships.
- Meaning extraction: Names, parameters, and what a function is really doing.
- Hardware context: MMIO, peripheral registers, and boot ROM expectations.
- Failure and edge behavior: Loops, asserts, error handlers, watchdog patterns.
The catch is that doing this once is doable. Doing it repeatedly across many builds or many devices is where the pain lives. If your workflow is mostly manual clicking, you spend most of your time re-doing extraction steps instead of thinking like an engineer.
RE Automation vs Manual RE
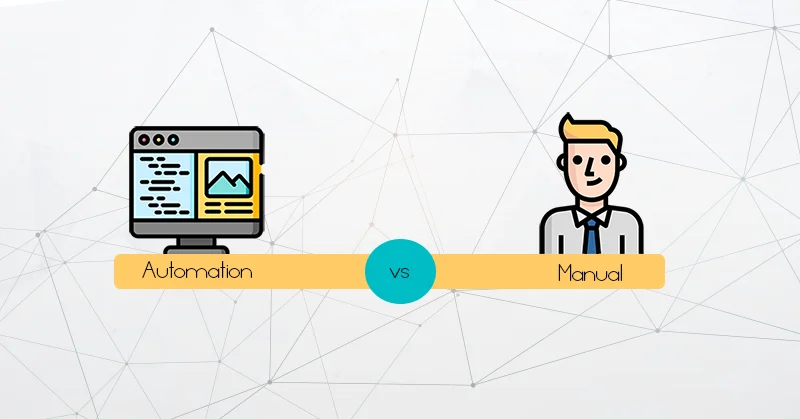
Manual RE is the interactive part: following cross-references, renaming functions, annotating structures, and tracing control flow until behavior makes sense.
Automation RE uses scripts to perform repeatable extraction and reporting tasks that are tedious by hand or easy to forget, such as:
- Exporting function lists, call graphs, and string inventories
- Extracting key regions (tables, vectors, jump dispatch) into structured artifacts
- Generating Markdown/JSON reports so results are comparable across versions
The best workflow is hybrid:
- Use automation to generate a reliable baseline map fast
- Use manual analysis to answer the hard questions (intent, state machines, edge cases)
- Feed manual findings back into automation (naming, annotations, extraction rules) so the next target is faster
Automation gives you consistency and speed. Manual RE gives you judgment. You need both.
Tooling landscape: why IDA Pro keeps showing up
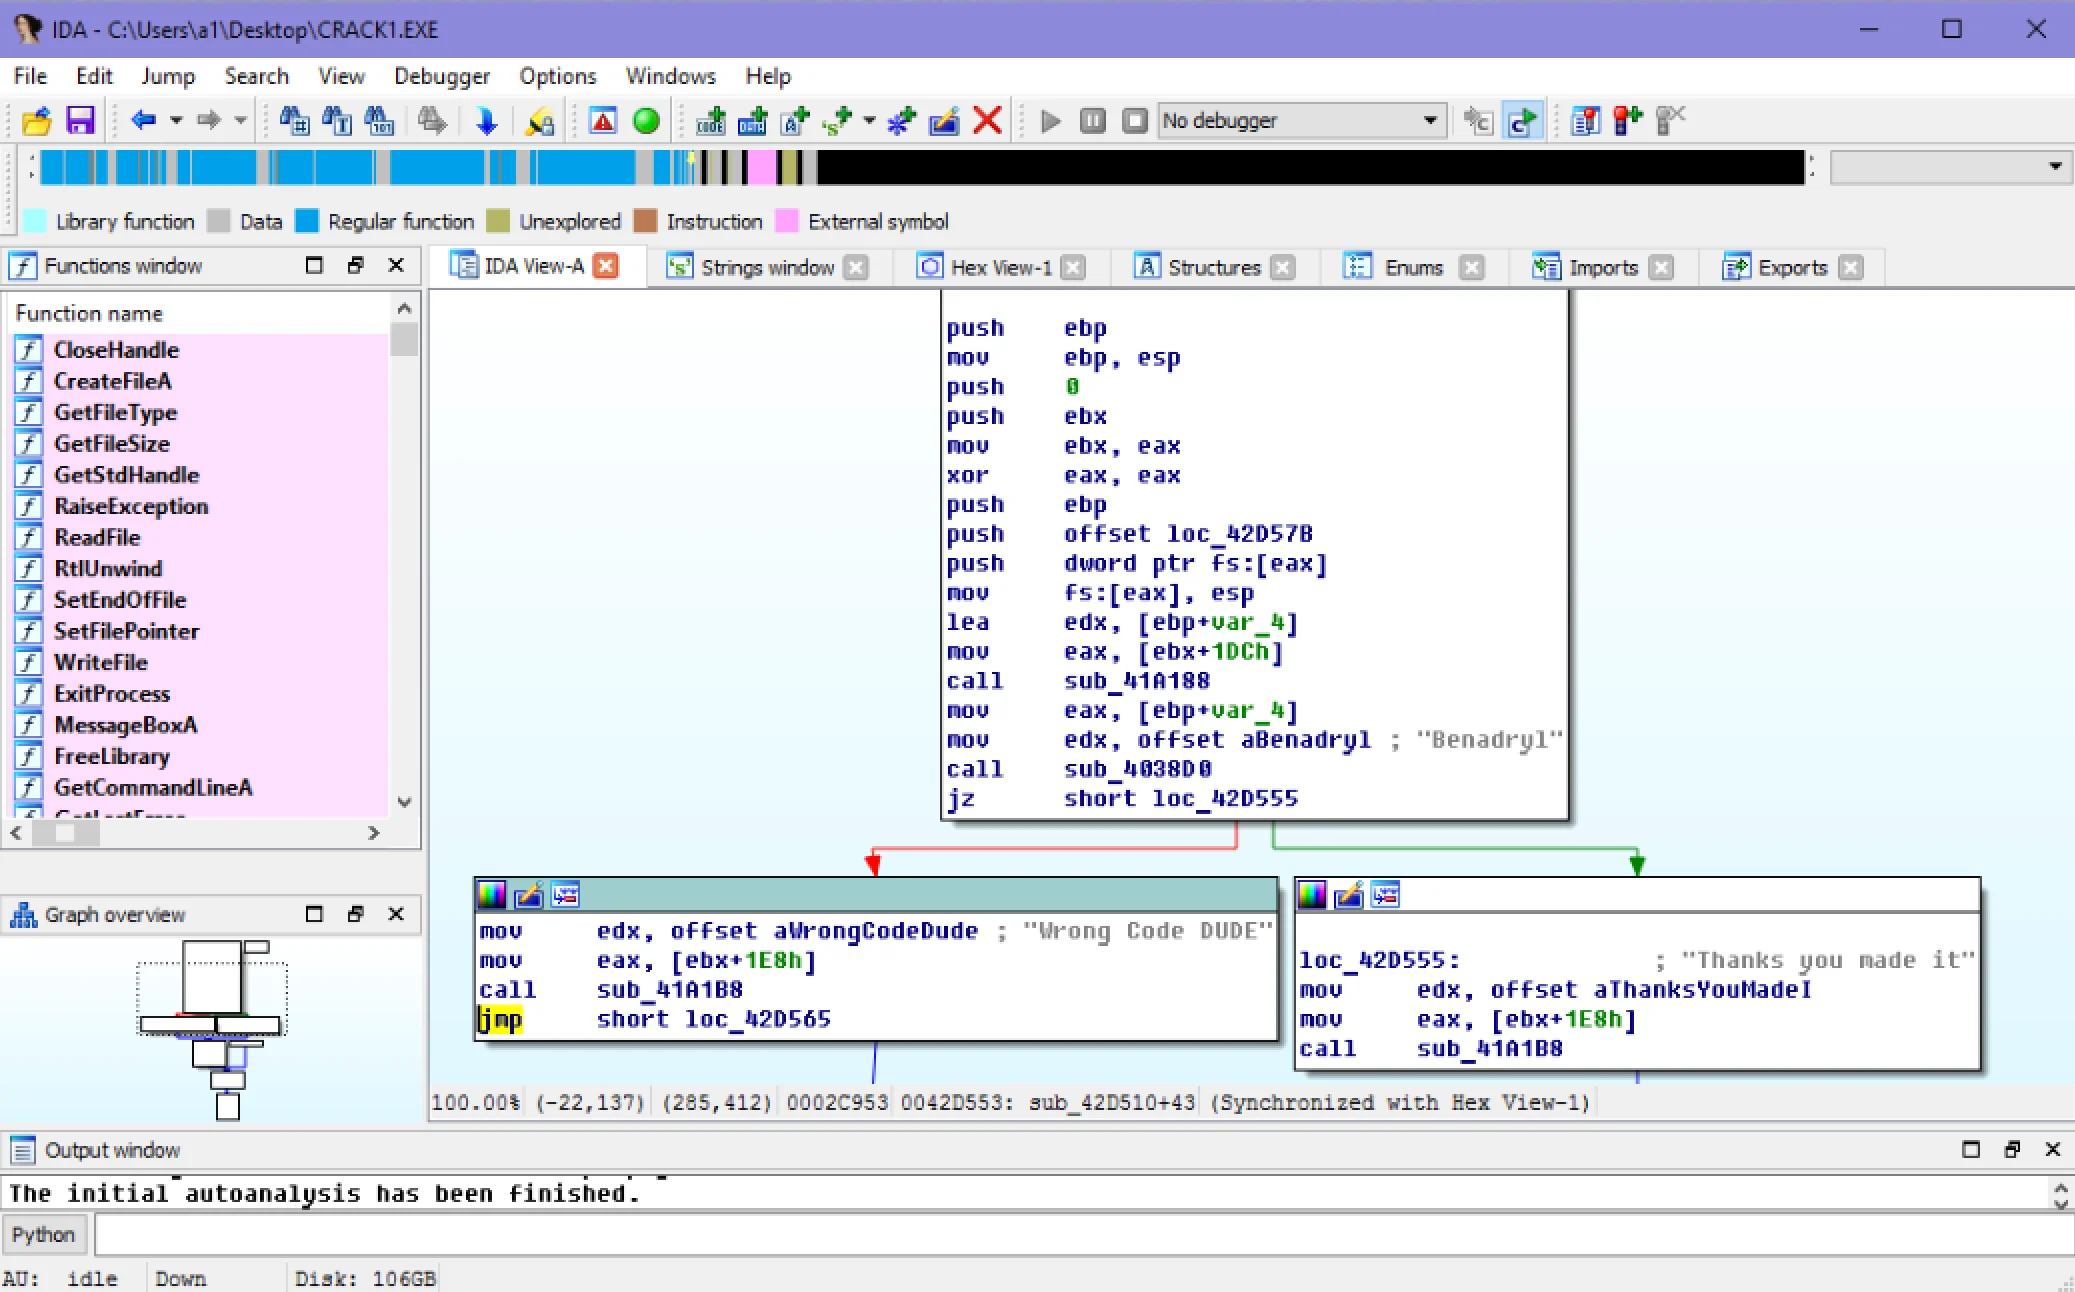
There are many solid tools in the RE ecosystem: Ghidra, Binary Ninja, radare2/rizin, objdump + GDB, Frida, and more. Each has strengths. But for firmware and bare-metal work, I keep coming back to one practical truth:
If you want an interactive GUI and a programmable analysis engine in the same place, IDA Pro is hard to beat.
IDA’s value is not only the UI. It is the ecosystem: a mature database model, rich cross-references, and, most importantly for scale, automation via IDAPython scripts. Once you can script extraction, you stop re-discovering facts and start generating artifacts.
Why I recommend IDA Pro (or Home) for automation, not IDA Free
This is the part many people miss when they first start: there is a difference between using IDA as a viewer and using IDA as a pipeline engine.
For automation, you typically want to run IDA in a headless or unattended mode:
- Load a binary
- Let analysis complete
- Run scripts
- Export reports
- Exit cleanly
That is how you scale to multiple targets, integrate with CI, or run overnight batches.
IDA Free is great for getting familiar with the UI, but it becomes a dead end when you want reliable automation:
- You cannot rely on [IDAPython(https://docs.hex-rays.com/developer-guide/idapython/idapython-getting-started)] availability the way you can with licensed editions
- Headless scripting flags may be ignored, so scripts may not execute and the process may not terminate cleanly
- Batch RE becomes fragile unless you add external timeouts and manual fallbacks
If your goal is to learn repeatable reverse engineering, not just one-off browsing, start with an edition that supports the workflow you eventually want.
The mindset shift: stop “looking” and start “producing artifacts”
When RE becomes part of your engineering workflow, the deliverable is not “I clicked around and I think I understand it.” The deliverable is a folder of artifacts you can diff, review, and share with your team:
- Call graphs (DOT/JSON) to see boot and initialization flows
- Memory access reports to highlight MMIO regions and suspicious reads/writes
- Failure path reports to flag dead loops, error handlers, and watchdog patterns
- Per-function summaries you can use as a navigation index
- A run log that tells you exactly what happened (and what did not)
Once you have those, your RE sessions become shorter and sharper. Instead of spending 45 minutes finding the boot path again, you open a graph, pick the interesting node, and move straight to the questions that matter.
Where my eBook fits: IDA Pro headless automation, taught as a workflow
That gap between “I can use IDA” and “I can automate IDA” is exactly why I wrote my eBook: IDA Reverse Engineering Automation Kit:
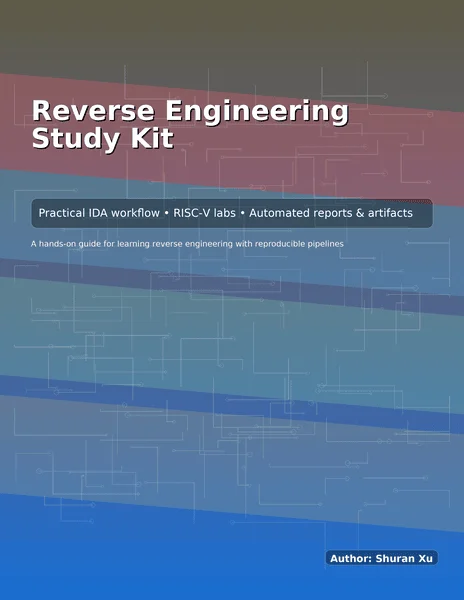
IDA Reverse Engineering Automation Kit — a practical guide and solution kit for building a repeatable IDA Pro pipeline (GUI + headless) aimed at firmware/bare‑metal targets.
Instead of treating RE like a purely manual art, the kit teaches an engineering workflow: configuration-driven runs that produce predictable outputs. It also includes hands-on labs using a toy RISC-V firmware so you can validate what the artifacts mean without guessing.
What you’ll be able to do after working through it
- Run a full analysis pipeline in a single command (ideal for batch processing)
- Export boot-path call graphs in DOT/JSON so you can visualize control flow quickly
- Generate MMIO-focused memory access reports to spot peripheral interactions fast
- Automatically detect failure loops / dead-end paths to accelerate debugging and security review
- Customize target configs (entry points, memory maps, graph depth) and see how outputs change
Who this is for
- Firmware engineers debugging boot issues without full source context
- Security researchers looking for verification gates, error handlers, and suspicious I/O
- Embedded engineers who want an artifact-first workflow that scales
- Students who want to learn RE beyond screenshots by running a pipeline and interpreting outputs
If you are curious whether this style fits you, ask yourself a simple question: would you rather spend your time clicking through the same discovery steps, or start each session with a clean set of generated facts?
References
IDA is developed by Hex-Rays. Prefer official Hex-Rays sources for downloads and purchase paths:
- IDA Home (hobbyist / non-commercial use): use the official Hex-Rays IDA Home page for purchase and download
- IDA Pro (commercial): use the My Hex-Rays customer portal after purchase for the installer and license details
Tip: Always prefer official Hex-Rays sources to avoid tampered installers.
As for my eBook Reverse Engineering Study Kit, you can purchase the eBook on Gumroad here. After purchase, Gumroad will email you the download link.
Closing thoughts
Reverse engineering is not just for malware analysts. It is an engineering tool for clarity. And like any tool, it becomes dramatically more powerful when you can automate the boring parts.
If you want to build a repeatable IDA Pro workflow that generates real artifacts (call graphs, MMIO reports, failure paths) and scales across firmware targets, this artifact-first approach is the shortest path from curiosity to useful answers.
If you want, I can also help draft a follow-up post showing a concrete GUI + headless pipeline and example outputs from a small firmware target.